UPDATE: Updated information about African American population in the south (because it’s higher than the rest of the country, 20% vs 12%)
On Tuesday night there was another civilian killed by police during an arrest, this time in my hometown of Baton Rouge. Alton Sterling was shot 6 times last night, making the national news in the most recent act of police brutality. Let’s sift through the data to see if we can find any trends.
DISCLAIMER: I am not making ANY stance on the issue here, I’m just looking through the data we have a little better than the guys at 538 did…
The Data
The data can be found here and contains incidents of police killing civilians from 2013-December 31 2015. They do a pretty comprehensive analysis on the bare numbers, noting that in 2015 5 times more unarmed African Americans were killed than unarmed White and Hispanic people. They do a summary of data in 2015 here. This data consists of the 3845 cases of police brutality since 2013. Also shockingly, between 2013-2016, there have been only 77 days where there was not a civilian killed by police!
Covariates considered
The data consists of many variables but in particular I will focus on the following ones:
Race: The breakdown of the data by race is shown below:

So as we can see the three biggest categories of civilians killed by police are Caucasians followed by African Americans, and Hispanic people. The rest I will group together as “other”
Gender: The breakdown of data by gender is shown below:

Clearly we have some mislabeling in the data here, as there’s not a White Gender and there is also some missing information. I’m only going to consider cases where the victim’s gender was male or female and will throw the rest out.
Did the Victim have a weapon:

I’m not going to look at the Unclear cases here, just weather or not the victim was armed or unarmed. I’m also not going to look at the cases involving a vehicle. The “unarmed” status here indicates whether they were visibly unarmed (including toy guns) at the time of being killed. This also includes cases where police said they we’re armed but other first hand witnesses disproved this assertion.
Region of U.S.: Take a look at the breakdown of the data by state
![]()
The states with the most police violence are California, Texas and Florida. There were also many incidences in Arizona, Georgia, North Carolina, New York, Ohio and Washington. So let’s break it down by region into Northeast, Southeast, West and Midwest.

So it looks like the South and West are the biggest culprits, with the Northeast having the lowest incidences of police brutality.
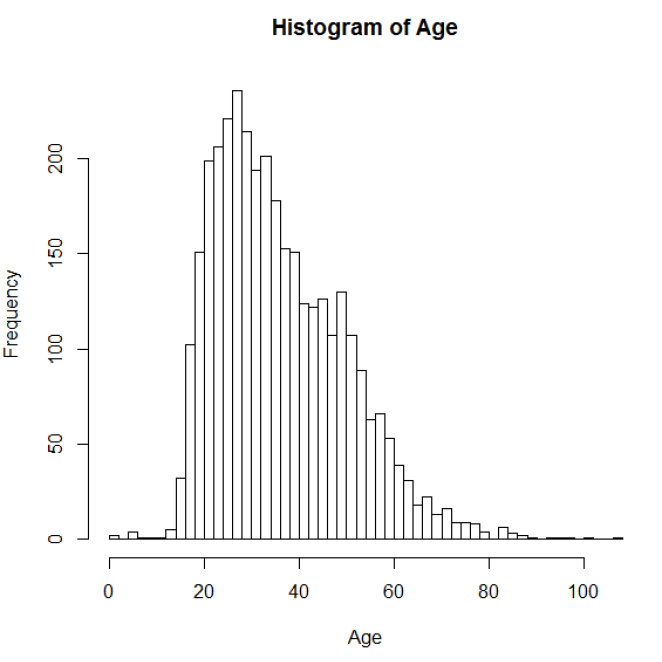
Age: Take a look at the histogram below of all available ages

As you can see most victims were between 20-60 years old, with a maximum age of 107 (which is pretty awful). It looks like it has a quadratic form as well.
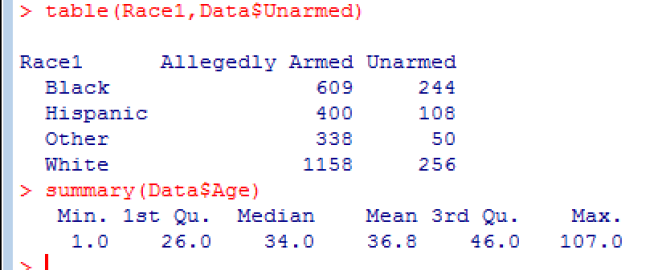
After throwing out the cases I mentioned above, we are left with 3163 incidences of police brutality and a quick summary of the above covariates for this reduced set is shown below.

So we see that there’s not a big difference in the proportions of victims who were armed within each racial group. However, we should note that 37% of the unarmed people killed by police are African-Americans, while they only make up 12% of the population. This is very disproportionate and points to what the recent protests are about. It’s always a tragedy when unarmed people are killed by police, even if they actually are committing a crime, and this tragedy happens disproportionately to African-Americans.
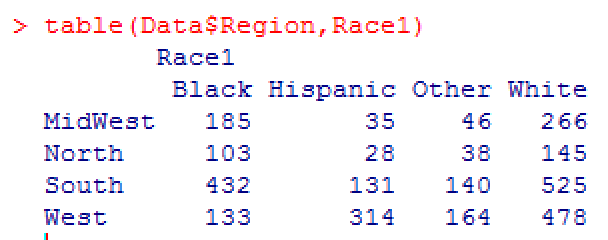
Now let’s look at the breakdown of incidences by region and by Race:

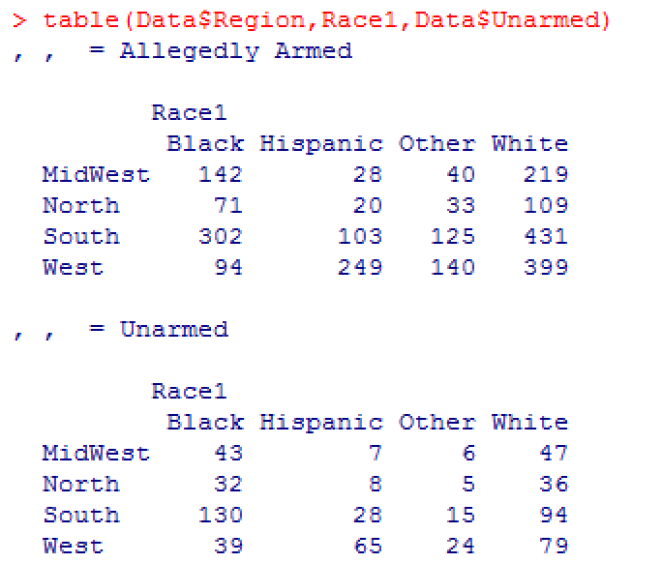
There were way more African Americans and Caucasians Killed in the South than in other regions and there were drastically more Hispanic people killed in the West than the rest of the country. But the biggest thing I found through sifting through this data shows up when we break down the police brutality by region, race and Armed status.

Southern Police kill unarmed African Americans more than any other race, encompassing about 48.6% of unarmed southern shootings. Since African Americans (table 5) make up about 20.11% of the southern population (from the 2010 census), this should be alarming.
But this is just data, you draw your own conclusions. There is definitely an issue here with police brutality and it has not gotten any better over time.
If you enjoyed this post, take a look at some of my other Adventures in Statistics.
-Andrew G. Chapple

Hey Andrew,
Very nice summary. I am curious, did you already, or is it possible, to control for total encounters with police? In other words, to figure out the risk factor considering that some races are probably stopped more than others.
Best,
Scott
LikeLike
I didn’t have that data available, well I didn’t look for it really. If we had that data of all police stops, we could fit a logistic regression model to whether or not that police stop led to injury or death as a function of covariates like race, region, age etc. That would be interesting for sure
LikeLike
So statistically, I have an issue with the data you presented and the facts given when you presented them. While you are correct that 12% of the nation identifies as African American, you do not take into account that according to the 2010 census, 55% of the population of the south Reported to be strictly African American. When you take into account those that are bi racial, the number rises to 60% according to the census data.
Now, if you just take the numbers in the South of unarmed people being killed of just white and and black, 58% of those killed were black. This data compared to the census data shows that a proportionate amount of blacks and whites were harmed by police. When compared to all races, the incidence of African Americans being harmed drops to 48%, which would be less than the percentage of the population.
To me, this data indicates that the police are harming people of all races proportionately to their population, even in the South. All the data needs to be considered before conclusions are drawn and this small bit of information completely changes the meaning of the data. If the 12% of African Americans was evenly distributed among the states then the data would point to brutality against blacks, but this is simply not the case.
LikeLike
This is not accurate, the census says that 55% of African Americans live in the south, not that the south is composed of 55% African Americans. Check out this link: https://www.census.gov/prod/cen2010/briefs/c2010br-06.pdf
Now go to table 5, if we add up all the people in the south that Identify as black in anyway we get:
B=1099649+22005433+23105082 = 46,210,164
and according to this link:
https://www.census.gov/popclock/data_tables.php?component=growth
there are 114,862,858 people in the south.
So this means the african american population in the south is:
(B/114862858)*100
[1] 40.23073 %
So yes, 58% of unarmed casualties is still higher than the 40.23% of the population that is African american.
However, I appreciate you pointing this out and will edit my post accordingly.
LikeLike
You are correct, I did misread the census data. Also, while white and black may be 58%, when black unarmed is compared to all races, this number drops to 48% if I am doing my math correctly. While 48% > 40% it is not extremely disproportionate.
Also, for those claiming that police have more restraint against armed whites, armed blacks were at 31% of all races in the south even though their population is greater than that. If you have the time, I’d be interested to see a statistical breakdown of police violence for armed and unarmed compared to the population percentage.
LikeLike
My math was actually wrong too! I double counted those that counted as partially or full african american (since that’s combined in the first column). Check it out:
Sorry actually I overinflated the african american population actually!
This is not accurate, the census says that 55% of African Americans live in the south, not that the south is composed of 55% African Americans. Check out this link: https://www.census.gov/prod/cen2010/briefs/c2010br-06.pdf
Now go to table 5, if we add up all the people in the south that Identify as black in anyway we get:
B=23,105,082 african americans in the south.
and according to this link:
https://www.census.gov/popclock/data_tables.php?component=growth
there are 114,862,858 people in the south.
So this means the african american population in the south is:
> (23105082/114862858)*100
[1] 20.11536 %
So just 20%! But they get killed in unarmed cases of police brutality 48% of the time!
Seems disproportionate to me!
However, I appreciate you pointing this out and will edit my post accordingly.
Anyways I made my edits to the post to reflect this!
LikeLike
Sorry actually I overinflated the african american population actually!
This is not accurate, the census says that 55% of African Americans live in the south, not that the south is composed of 55% African Americans. Check out this link: https://www.census.gov/prod/cen2010/briefs/c2010br-06.pdf
Now go to table 5, if we add up all the people in the south that Identify as black in anyway we get:
B=23,105,082 african americans in the south.
and according to this link:
https://www.census.gov/popclock/data_tables.php?component=growth
there are 114,862,858 people in the south.
So this means the african american population in the south is:
> (23105082/114862858)*100
[1] 20.11536 %
So just 20%! But they get killed in unarmed cases of police brutality 48% of the time!
Seems disproportionate to me!
However, I appreciate you pointing this out and will edit my post accordingly.
LikeLike
Great thoughts, I appreciate having an objective way to look at things. The one thing I’d be interested to see, and I don’t know how easy it would be to get the data, is changing your exposure basis from general population statistics to get police encounters split by race, particularly violent crime responses (like receiving a call involving a weapon for instance). Not saying that it would necessarily show different results, but it seems like a bad basis to use general population numbers, because different segments of the population could have significantly different crime patterns or incidents involving interaction with police
LikeLike